How to use the Farmers DashboardLink
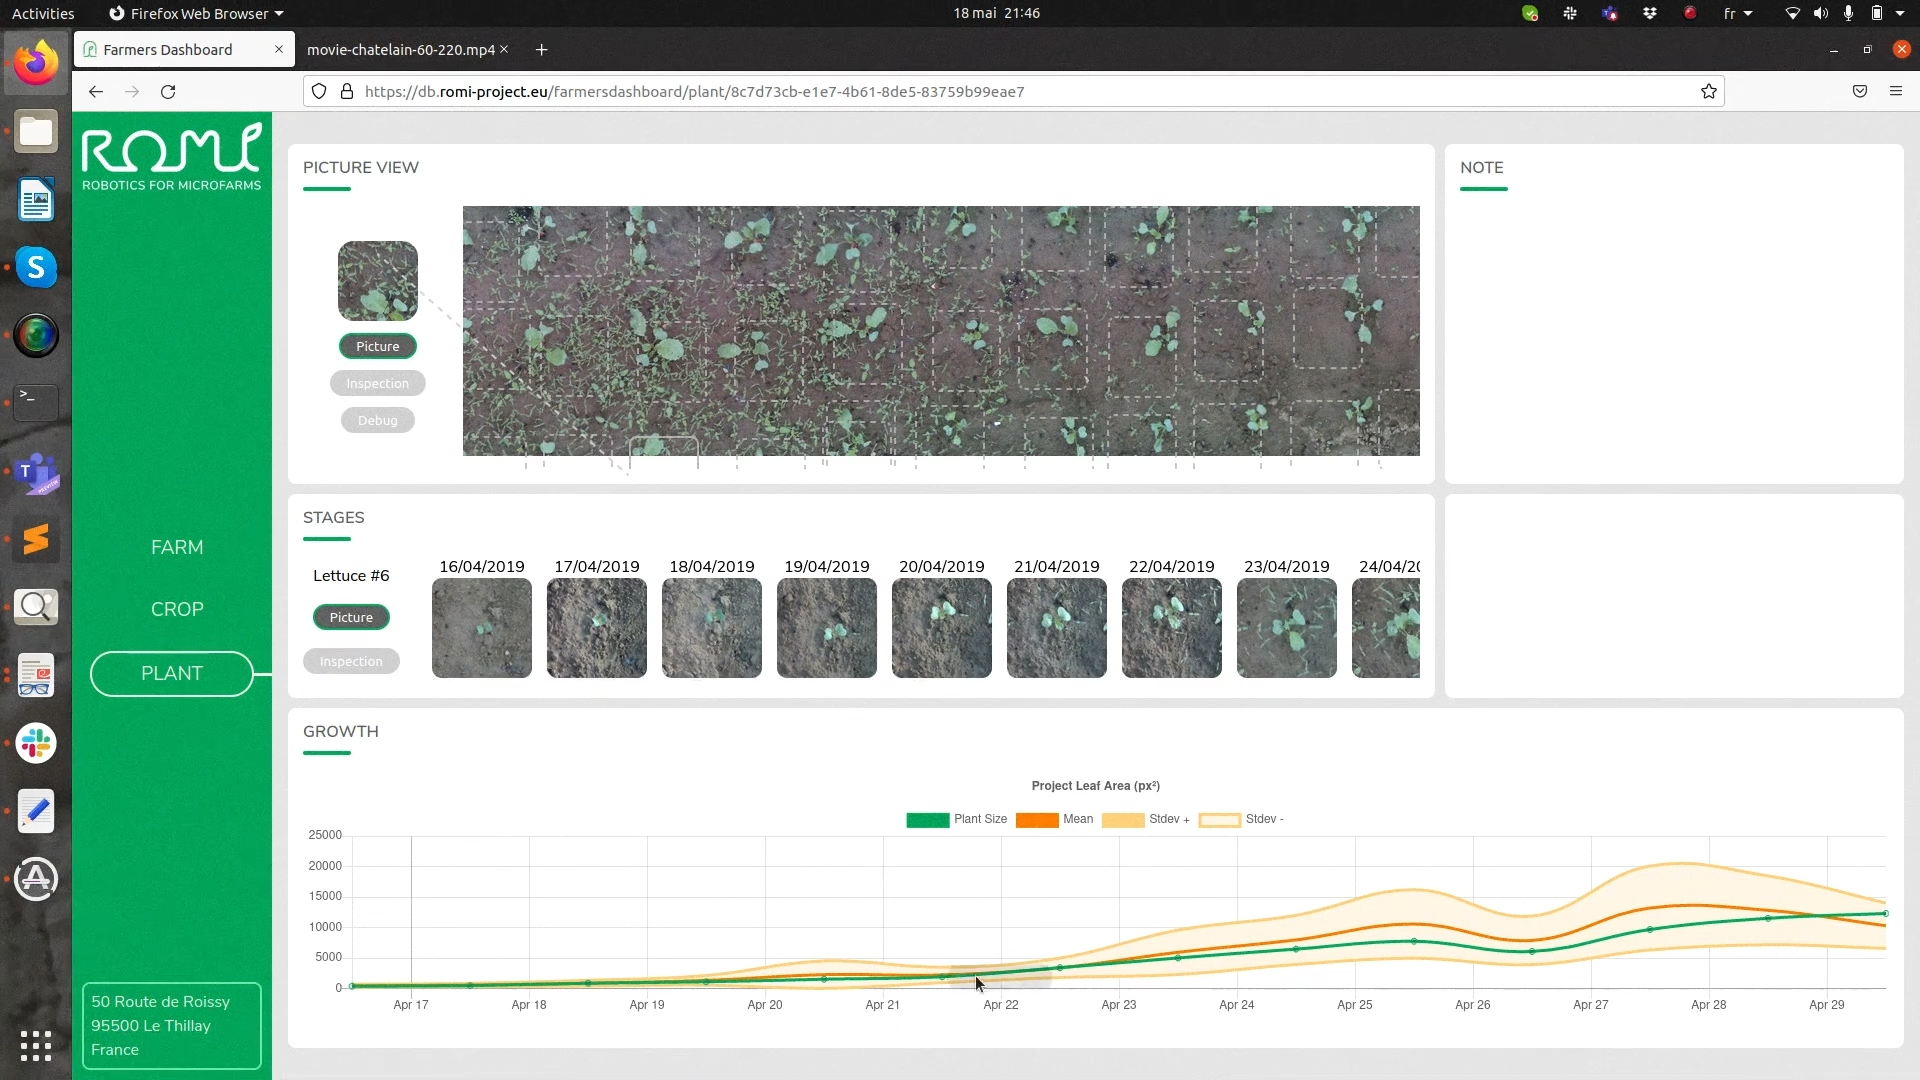
The Farmer's Dashboard is a powerful tool developed as part of the Robots for Microfarms (ROMI) project. It collects data from the Cablebot and provides an overview of what's growing in the field. The primary purpose is to extract detailed information about individual plants and their growth progress.
The Dashboard is currently tailored to the specific work within ROMI, focusing on data collection from the Cablebot and crop monitoring. Watch the video to learn more about the objetives and current functionality behind that tool.
Some graphical user interfaces are currently under development. For more detailed instructions on the operation and control commands, refer to the ongoing software repositories ROMI Pipelines and ROMI Farmers Dashboard.
Main functionalitiesLink

Combining Data for Farm ManagementLink
The Farmer's Dashboard combines Cablebot data with the farm's planning process, enabling effective farm management.
- Efficient Planning: It assists in determining seeding, harvesting, and the composition of vegetable baskets for sale.
- Data-driven Adaptation: Farmers can adapt and predict harvests more efficiently using the Dashboard's statistics.
Analytics and Remote UsageLink
The Dashboard serves as an analytics tool, enabling remote usage and data analysis.
- Schedule-based Scans: Daily or weekly scans of the crop are taken using the Cablebot, and the data is uploaded to a computer.
- Insightful Metrics: Analytics and metrics provide insights into crop productivity, infestations, diseases, and environmental factors affecting growth.
Parcel Numbering and Geo-ReferencingLink
Precise tracking of planting locations is facilitated through parcel numbering and geo-referencing.
- Fieldwork Aid: Parcel numbers and geo-references help streamline data logging during fieldwork.
- Valuable Research Data: The data serves as valuable research information for crop growth patterns, weather correlation, and statistical analysis.
Evolution of the Farm Management SystemLink
The Farmer's Dashboard aims to become an integral part of a comprehensive farm management system.
- Data Integration: The Dashboard will integrate Cablebot data with the initial farm planning done by farmers.
- Predictive Modeling: Potential incorporation of predictive modeling for plant growth based on historical statistics.
Image Processing for Crop MonitoringLink
The Farmer's Dashboard employs advanced image processing for detailed crop monitoring.
- Image Pair Analysis: The Dashboard analyzes image pairs from the Cablebot's camera to create comprehensive crop bed maps.
- Daily Growth Curves: Multiple images along the Cablebot's path generate daily growth curves for individual plants.