How to Choose Linear Coefficients and Threshold Parameters for Plant‑Mask GenerationLink
Goal: Find a set of channel‑mix coefficients (C₁, C₂, C₃) and a
min_threshold that isolate the plant in a binary mask for your specific imaging setup.
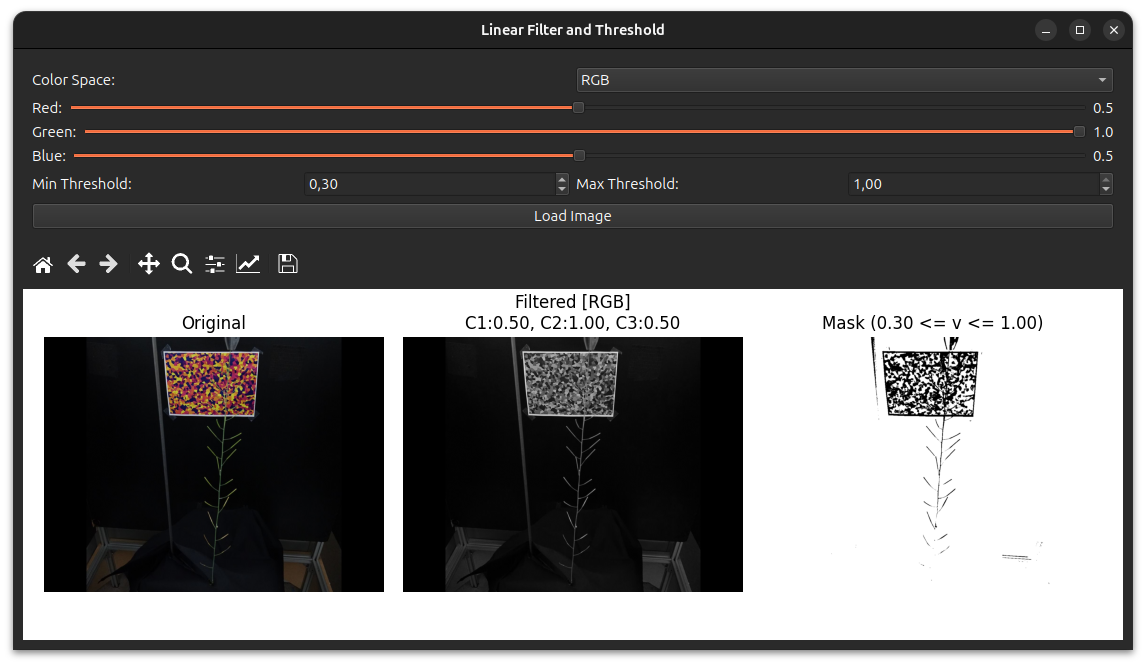
1. Launch the GUILink
conda activate plant3dvision
linear_filter            # starts the app
If you already have an image you want to test, you can also start the app with the path:
linear_filter path/to/image.jpg
2. Load an ImageLink
- Click Load Image.
- In the file‑dialog, navigate to the folder that contains one of the images from your dataset and select it.
The original picture appears on the left panel of the display area.
3. Pick a Color Space (optional)Link
The dropdown Color Space lets you work in RGB (default), HSV, or YCbCr.
- Use RGB for most plant‑imaging cases.
- Switch to HSV or YCbCr only if the plant colors are not well separated in RGB (e.g., strong hue shifts).
4. Tune the Channel CoefficientsLink
Three horizontal sliders control the contribution of each color channel (values = 0 – 1).
| Slider | Default label | Typical plant‑specific advice |
|---|---|---|
| C₁ | Red / Hue / Luminance | Increase if the plant appears reddish or yellowish. |
| C₂ | Green / Saturation / Blue‑diff | Keep at 1.0 for healthy green foliage. |
| C₃ | Blue / Value / Red‑diff | Reduce to suppress background sky or water reflections. |
Tips
As you move a slider, the Filtered image (centre panel) updates instantly, letting you see how the grayscale intensity changes.
Remember
This is an additive RGB color model, see Wikipedia for detailed explanations.
5. Set the Threshold RangeLink
Two spin boxes control the binary mask:
- Min Threshold: lower bound (default 0.30).
- Max Threshold: upper bound (default 1.00).
Start by leaving Max Threshold at 1.00 and move Min Threshold downward until the plant silhouette is fully visible but background noise is minimized. Inversely, if the mask becomes too sparse, lower the value slightly.
The Mask panel on the right shows the resulting binary image in real time.
6. Iterate Until SatisfiedLink
- Adjust the three coefficients and the
min_thresholdas described above. - Observe the three panels (Original | Filtered | Mask).
-
Confirm that:
- The whole plant (including stems) appears white in the mask.
- Unwanted bright artifacts (e.g., specular highlights) are either removed or acceptable for downstream analysis.
-
When the result looks good on the first image, repeat the same parameter set on a second image from the same dataset to verify robustness. Small illumination changes may require a modest tweak of the**Min Threshold**.
7. Record the Final ParametersLink
Write down the three channel coefficients and the chosen min_threshold (and max_threshold if you changed it).
Use these values in your reconstruction TOML configuration file.
Quick Reference (cheat‑sheet)Link
| Control | How to adjust | When to change |
|---|---|---|
| Color Space | Drop‑down menu | Plant color not well separated in RGB |
| Red / Hue / Y | Slider (0–1) | Plant has significant red/yellow component |
| Green / Sat / Cb | Slider (0–1) | Keep at 1.0 for typical green foliage |
| Blue / Val / Cr | Slider (0–1) | Reduce to suppress background blues |
| Min Threshold | Spin box (0.0–1.0, step 0.01) | Increase to cut background, decrease to fill gaps |
| Max Threshold | Spin box (0.0–1.0, step 0.01) | Rarely needed; keep at 1.0 unless you want to clip bright outliers |
By following these focused steps, you’ll quickly arrive at a reliable linear‑mix and threshold configuration that isolates your plant for downstream analysis. Happy masking!